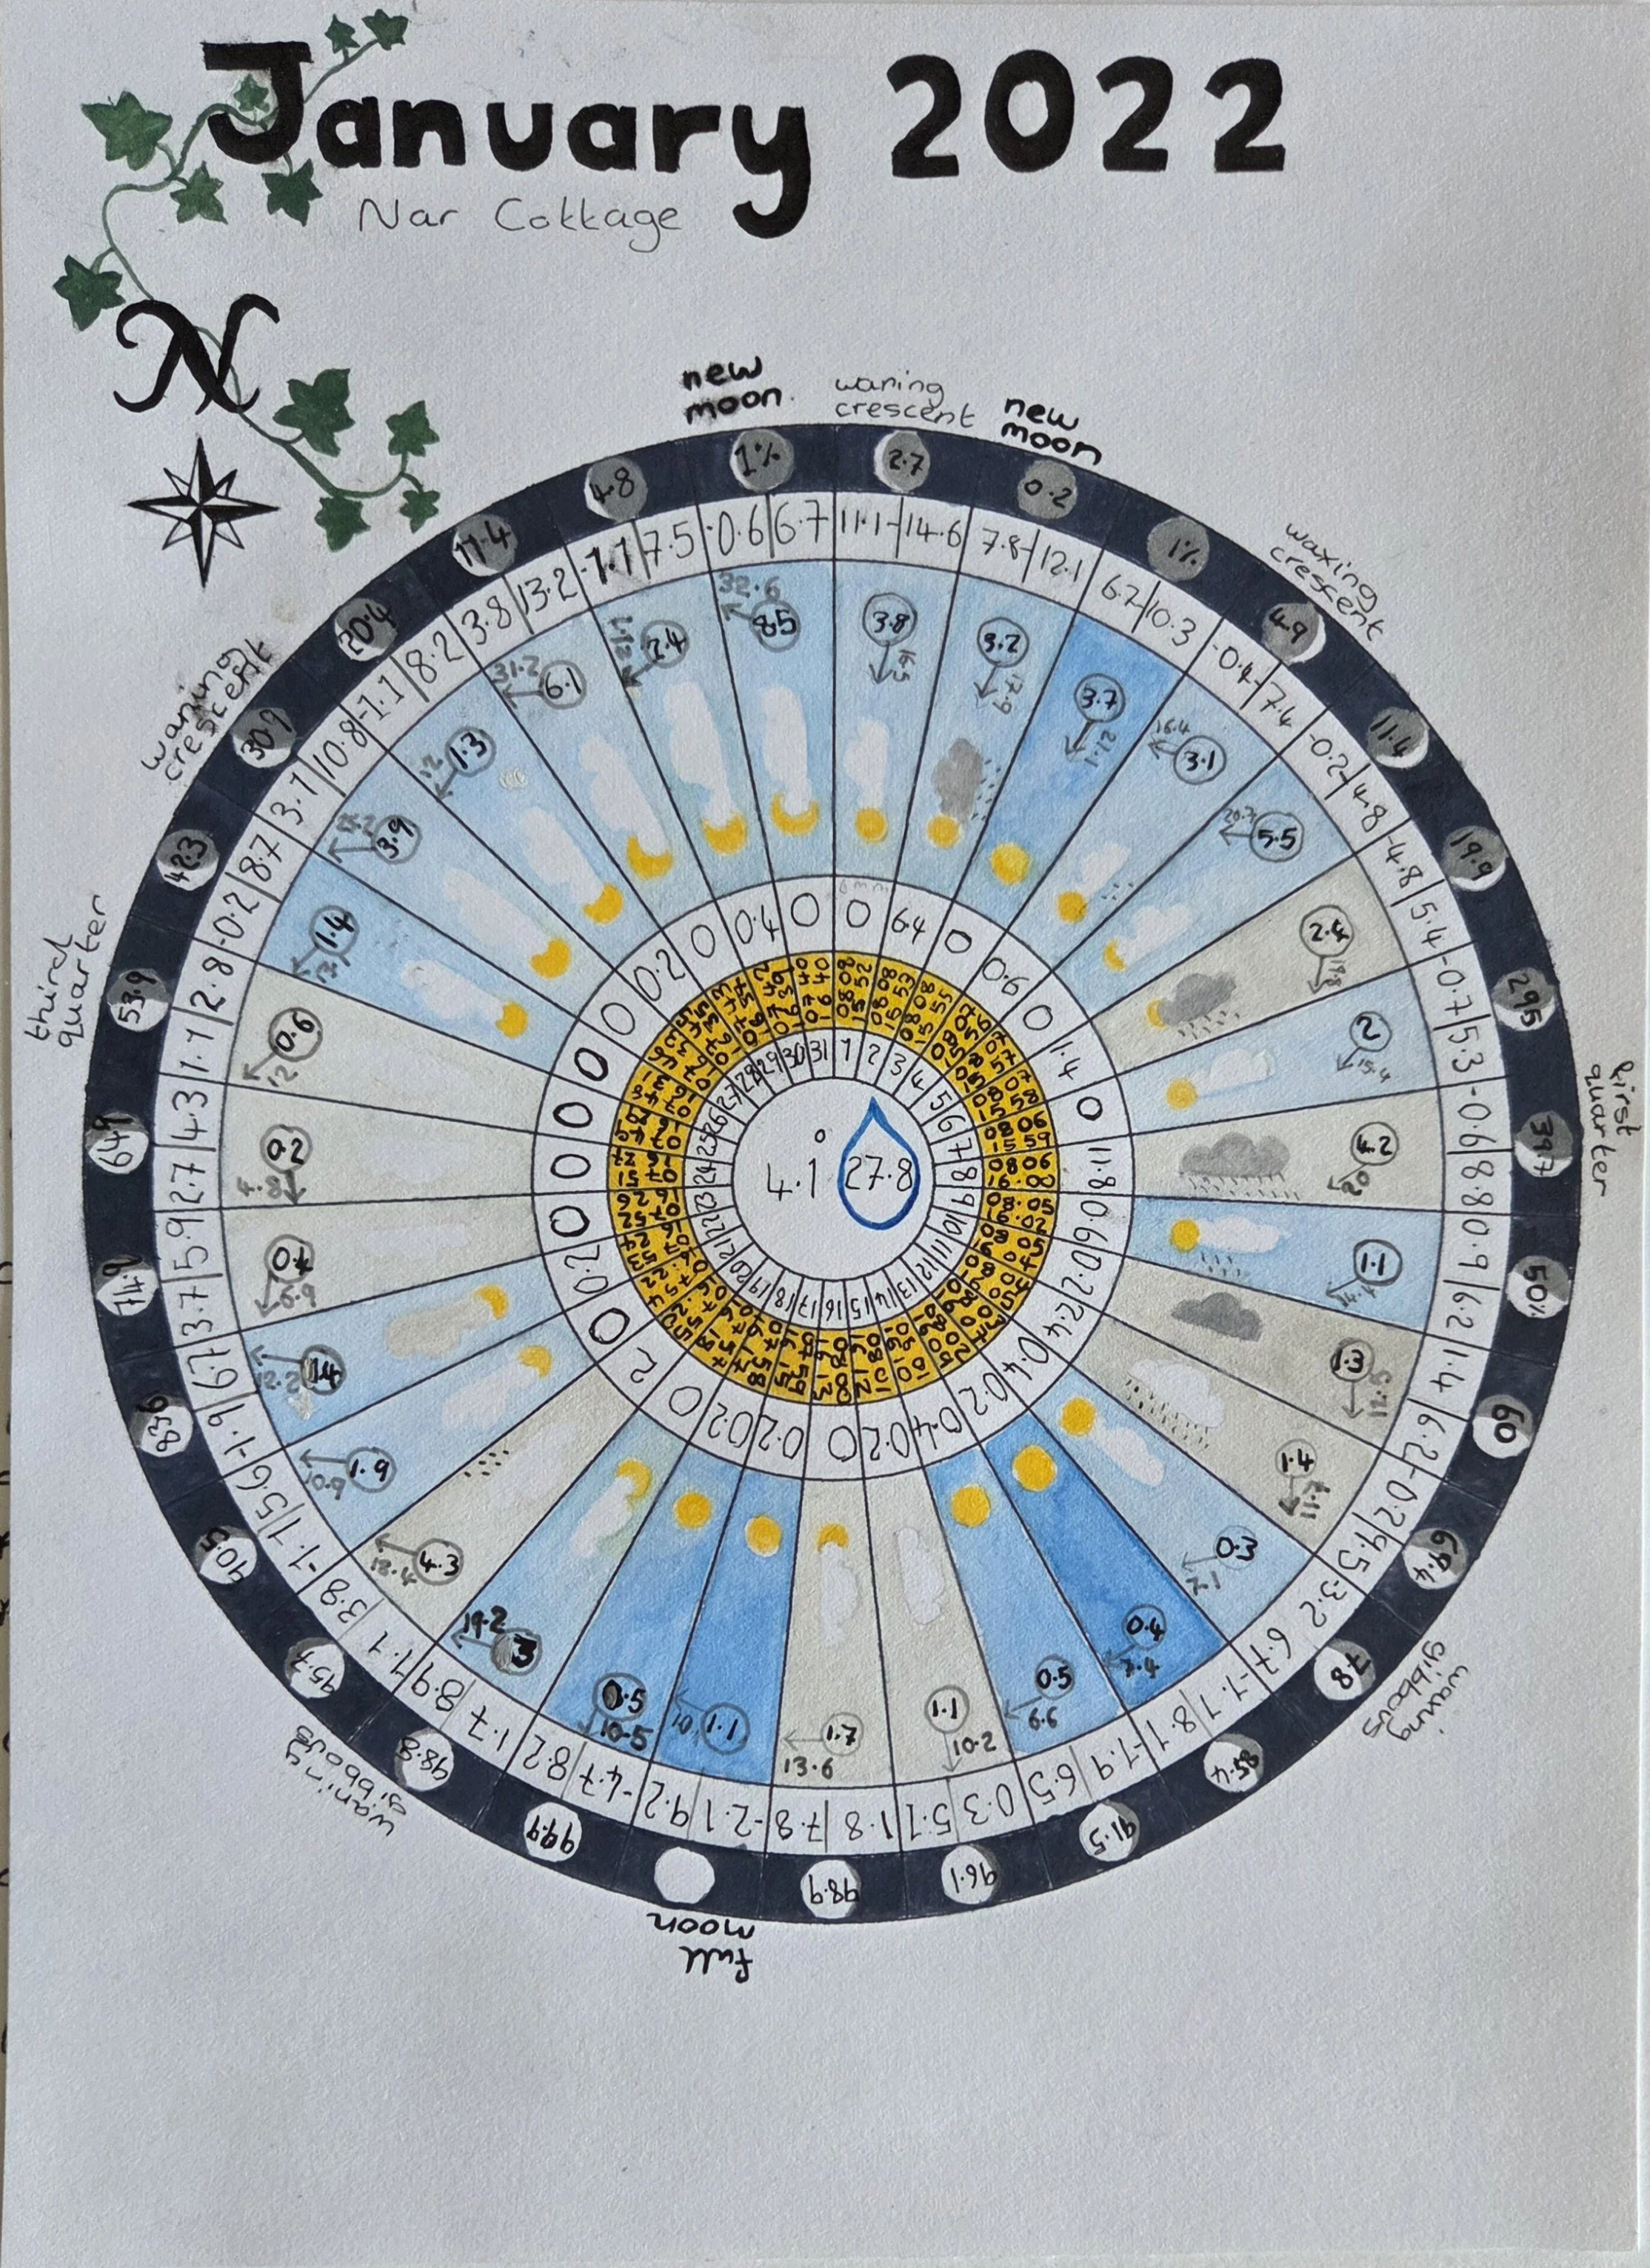
Discovering Phenology Wheels is really what got me going in nature journalling. Being a diagram, they did not require me to have any artistic ability beyond using a compass and protractor, whilst being a fun, visually interesting way to present data sets. Perfect!
What are Phenology Wheels?
Phenology means the study of the seasons in nature. A phenology wheel is a circular diagram divided into segments that each represent a defined time period. Inside each segment seasonal data and/or visual information is displayed, which over time creates a broader picture of seasonal trends or cycles. Phenology wheels are most often divided into calendar or lunar months in a year or days in a month.
Being a weather geek, I decided to do one phenology wheel per month using key data, in particular maximum and minimum temperatures and precipitation, recorded by our weather station. This is how my January Weather Wheel turned out: